on
Debugging In Rider and Unity, 101 and beyond
Debugging: The Ultimate Skill for Sanity Preservation 🧠💥
Debugging isn’t just a skill; it’s an art. The difference between a seasoned dev and a junior often boils down to how fast they can pinpoint and obliterate bugs. A well-debugged game runs like a finely tuned spaceship; a poorly debugged one is a flaming wreck hurtling through the void of despair. 🌌🔥
In this guide, I’ll introduce you to the essential debugging tools in JetBrains Rider when working with Unity, then take you beyond the basics into Debugger Mastery. We’ll explore powerful techniques, best practices, and the kinds of tricks that make debugging feel like hacking the Matrix. 🕶️
The Basic Debugging Tools 🛠️
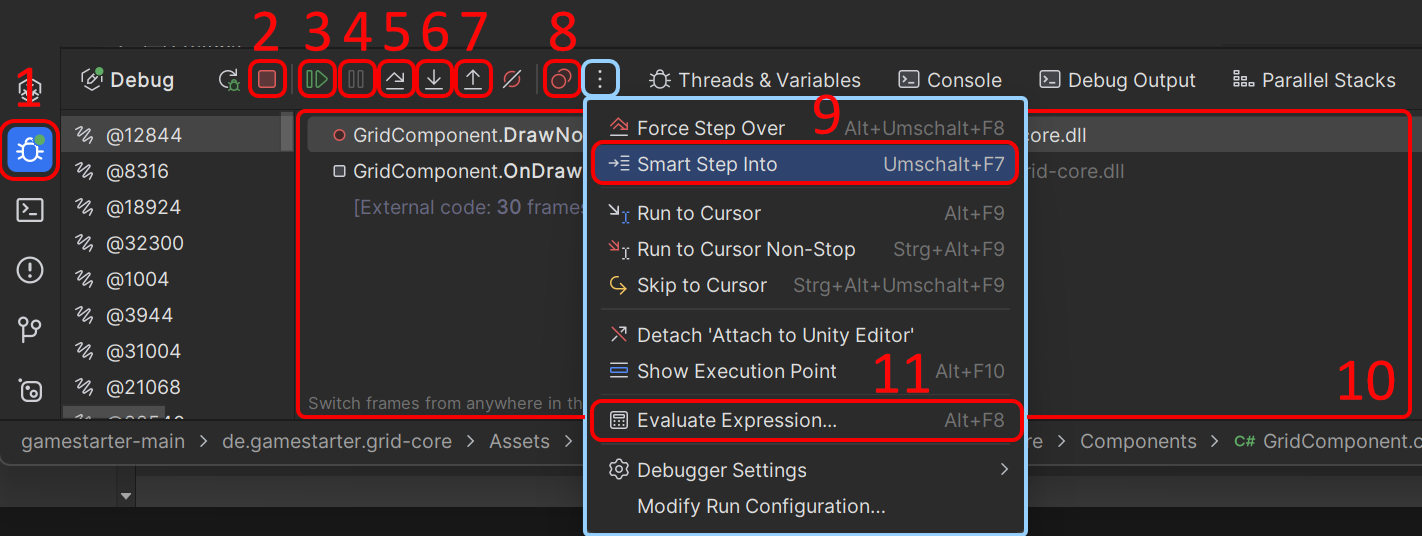
1. Debug Window Button 🖥️
Opens the Debug window, where you can inspect variables, breakpoints, threads, and the call stack. Think of it as your Mission Control Center. 🚀
2. Stop Attach Unity Editor 🛑
Detaches Rider from the Unity Editor without closing Unity itself. Useful when you’re done debugging but don’t want to reboot the universe.
3. Resume Program (F9 / ⌘ + ⌥ + R) ▶️
Continues execution after hitting a breakpoint. Perfect when you just want to let your game run free again… until the next breakpoint hits.
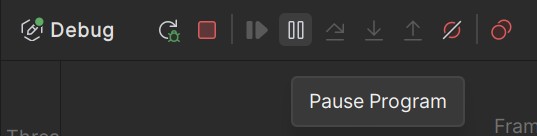
4. Pause Program ⏸️
Suspends execution at the current point so you can inspect what’s happening. Ideal when Unity is acting possessed, and you need to perform an exorcism. 👻
5. Step Over (F10 / ⌘ + ⇧ + O) 🔄
Moves to the next line without stepping into functions. Great when debugging loops but avoiding rabbit holes. 🕳️
6. Step Into (F11 / ⌘ + ⇧ + I) 🔍
Enters the function on the current line. Like diving deep into an unexplored dungeon.
7. Step Out (⇧ + F11 / ⌘ + ⇧ + U) 🏃
Exits the current function and returns to the caller. Useful when you realize you just stepped into a 500-line beast of a method by accident.
8. View Breakpoints and Exceptions (Ctrl + Shift + F8 / ⌘ + ⇧ + F8) 📌
Opens a window listing all active breakpoints and exception settings. Like having a map of all your traps and landmines. 💣
9. Smart Step Into (Shift + F7 / ⌘ + ⇧ + F7) 🧠
Lets you pick which function to step into when multiple are on the same line. No more getting dragged into irrelevant code like a side quest you didn’t ask for.
10. Stack Trace Window 🛤️
Shows the execution path, helping you understand how you got where you are. Because sometimes, retracing your steps is the only way to escape the debugging labyrinth.
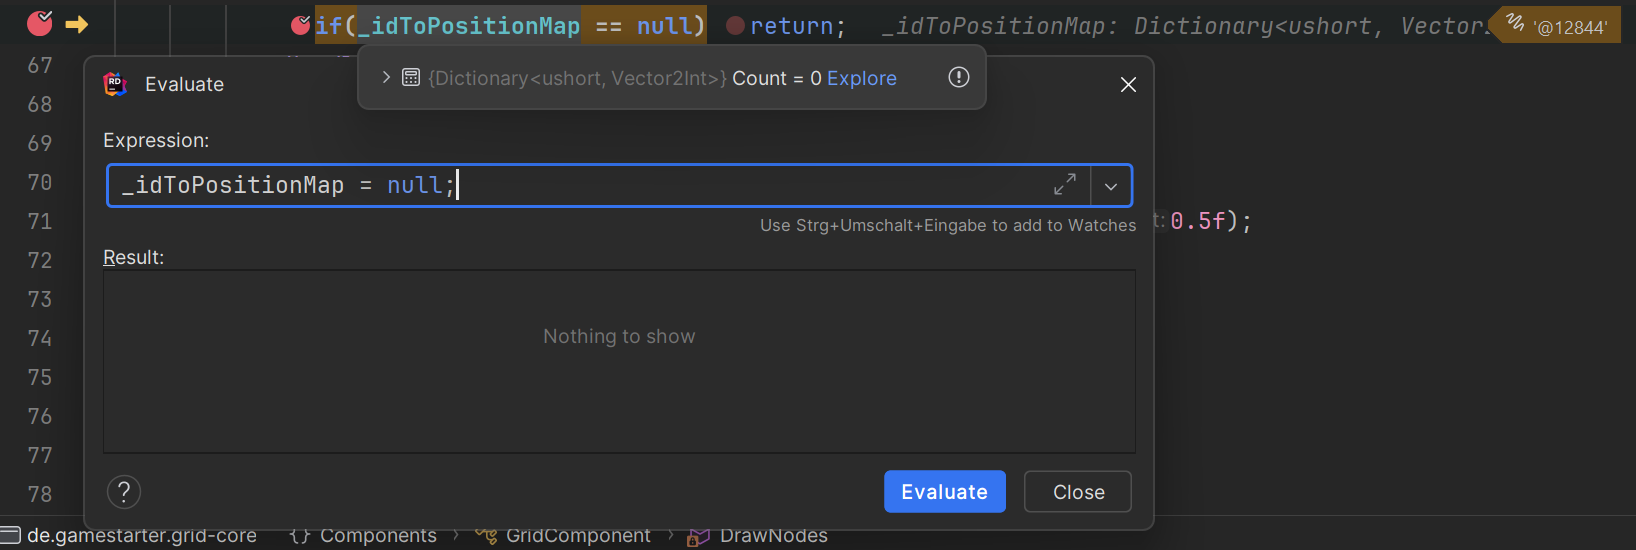
11. Evaluate Expression (Alt + F8 / ⌥ + F8) 🧪
Lets you test and manipulate variable values on the fly. Ever wish you could just fix a bug without stopping the game? Welcome to the future. 🚀 (well … almost, you still need to fix it after you stopped debugging ¯\(ツ)/¯ )
Advanced Debugging Techniques 🧙♂️
Evaluate Expression: Debugging God Mode 👨💻
Picture this: You’re hunting down an elusive bug, and suddenly realize you forgot to call Init() in your class. Normally, you’d stop, tweak the code, restart Unity, and reproduce the bug. Ugh. 😤
Not anymore! Just set a breakpoint, right-click anywhere in Rider, choose Evaluate Expression, and manually call Init() like a debugging deity. You can also tweak variables in real-time—flip a boolean, change a value, or even simulate a failed API call on the spot.
Dragging the Execution Pointer: Time Travel for Debuggers ⏳

Meet the yellow arrow: your very own DeLorean for debugging. It shows which line of code is about to execute, but here’s the fun part—you can drag it to move execution forward or even back in time! 🚀
Ever stepped over a function too quickly and realized you missed something? No worries—just move the arrow back and step in again. It’s like having a Save/Load feature for your debugging process.
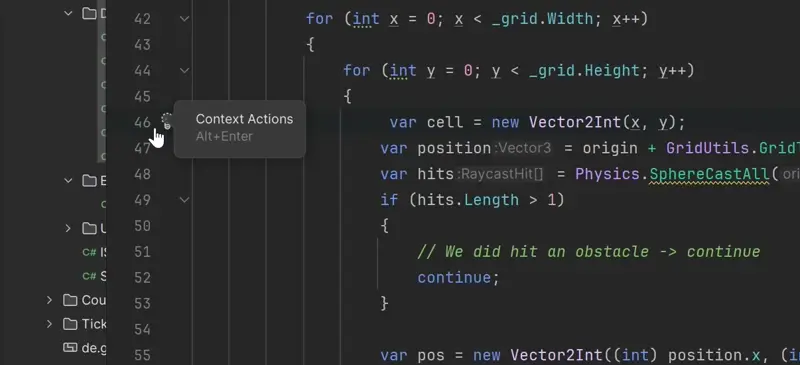
Conditional Breakpoints: Debug Like a Pro 🛑
Ever wanted to break execution only when a variable meets a specific condition, like x == 3 && y == 5? That’s where conditional breakpoints come in.
Just create a breakpoint, right-click it, and add a condition. You’ll thank yourself when debugging a loop that runs a thousand times, but you only care about iteration 999. 🧠
Unity Pausepoints: When Code Isn’t Enough ⏯️
Sometimes, you don’t need to break execution—you just want to pause Unity itself. This is handy for checking animations, physics, or UI at specific frames. Just add a Unity Pausepoint instead of a regular breakpoint!

Debugging Tips & Tricks 🎩🐇
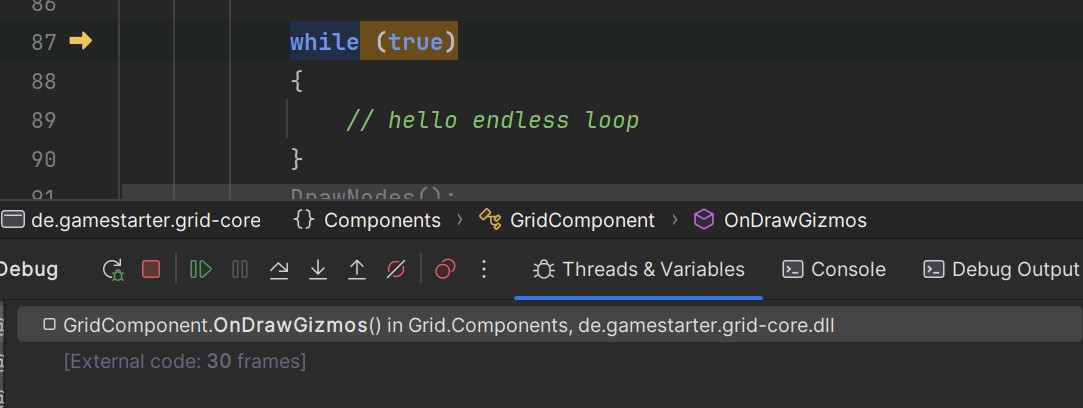
Rescue Your Game from an Infinite Loop 🔄🚨
Ever had your game stuck in an endless loop, Unity frozen, and your only option was rage-quitting? Next time, attach the debugger, click Pause Program, and it will teleport you straight to the offending line of code. You can even move the execution pointer outside the loop and continue as if nothing happened. 🦸♂️
Method and Exception Breakpoints: Break Smarter, Not Harder ⚡
Normally, breakpoints are tied to specific lines of code. But what if you want to break whenever a certain method is called, anywhere in the code? Enter Method Breakpoints!
Want to halt execution every time Debug.Log() is called? Just set a Method Breakpoint on UnityEngine.Debug.Log(), and boom—you’ve got eyes everywhere. 👀
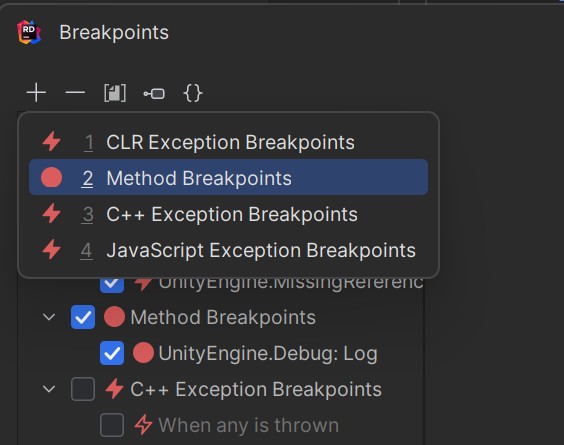
Similarly, you can break execution whenever a specific exception is thrown—no need to manually trace logs. If you only want to keep your eyes on the code you can control and fix, don’t forget to enable Only break on exceptions thrown from user code

Final Words 🎤
Debugging isn’t just about fixing bugs; it’s about mastering your tools and bending Unity to your will. Rider gives you some of the best debugging capabilities out there—so use them, and soon you’ll be that dev who finds and fixes bugs before anyone else even notices them. 🚀
📚 References
1️⃣ JetBrains Rider: Breakpoints
2️⃣ JetBrains Rider: Breakpoints Dialog
3️⃣ JetBrains Rider: Debugging
4️⃣ JetBrains Rider: Exception Breakpoints